The gating module comprises the most complex parts of our analysis workflow. It consists of two crucial processes:
- binning the GFP+ population into subpopulations
- split the MyHC+ and MyHC- population inside each GFP+ subpopulation
1) Binning the GFP+ population
The expression of GFP-labeled KRAS is not homogeneous within the GFP+ population. However, the magnitude of this expression may affect C2C12 cell differentiation. To analyze this effect, we need to increase the granularity of our analysis by splitting (or binning) the GFP+ population into smaller subpopulations.
We allow users to customize the number and size of these
subpopulations using a numeric inputs. Users can add a maximum of three
subpopulations (low, medium, high). We use the
gate_limits( ) function to fetch the users’s numeric inputs
and save them inside a list.
gate_limits <- reactive({
  withProgress(message = "Calculating gate limits...", {
    x <- list(low = if(!is.null(input$gfp_range_1)) list(input$gfp_range_1),
              medium = if(!is.null(input$gfp_range_2)) list(input$gfp_range_2) else {list(NA)},
              high = if(!is.null(input$gfp_range_3)) list(input$gfp_range_3) else {list(NA)})
    x[!sapply(x, is.na)]})
})
The gates variable saves the GFP-low, GFP-medium and
GFP-high rectangle gates created from these inputs.
gates <- reactive({
  withProgress(message = "Creating gates...", {
    # stop execution if gate_limits() is NULL
    if (is.null(gate_limits())) return(NULL)
    # if gate_limits() is not NULL, execute code below
    filter_names <- c("GFP-low", "GFP-medium", "GFP-high")
    y <- lapply(gate_limits(), function(x) {
      names(x) <- r$ch_kras()
      rectangleGate(x)})
    for (i in seq_along(y)){
      y[[i]]@filterId <- filter_names[[i]]
    }
    return(y)
  })
})
Finally, we add the gates to the GatingSet and recompute the GatingSet to effectively split the GFP+ population into different subpopulations.
observe({
  for (i in seq_along(gates())) {
    gs_pop_add(r$gs, gates()[[i]], parent = "GFP+")
  }
  recompute(r$gs)
}) |> bindEvent(input$confirm_bins)
2) Splitting the MyHC+ and MyHC- population
In our differentiation assay, the MyHC protein is targeted using an eFluor660-labled antibody. This antibody emits fluorescence captured in the red channel of our flow cytometer. Moreover, expression of this protein correlated with cell differentiation. Thus, if cells differentiate, they express more MyHC and consequently higher fluorescence intensities are captured on our flow cytometer. A typical distribution of red fluorescence observed for our differentiation assay is illustrated below. The left peak (light blue) comprises cells that do not express high amounts of MyHC and are considered undifferentiated. We name this population MyHC-. The right peak (pale green) corresponds to cells expressing high amounts of MyHC and are considered differentiated. We name this population MyHC+.
library(ggplot2)
set.seed(2345)
data.frame(x = c(rnorm(10000, 10, 50),
                 rnorm(2500, 35000, 35000))) |>
  ggplot(aes(x = x)) +
  geom_histogram(bins = 200, fill = "red") +
  annotate(geom = "rect", xmin = 1, xmax = 1000, ymin = 0, ymax = 270,
           fill = "lightblue", alpha = 0.5) +
  annotate(geom = "rect", xmin = 1000, xmax = 200000, ymin = 0, ymax = 150,
           fill = "palegreen", alpha = 0.25) +
  theme_bw() +
  theme(axis.title = element_text(size = 15)) +
  scale_x_log10() +
  xlab("RED.R.HLin (RFU)")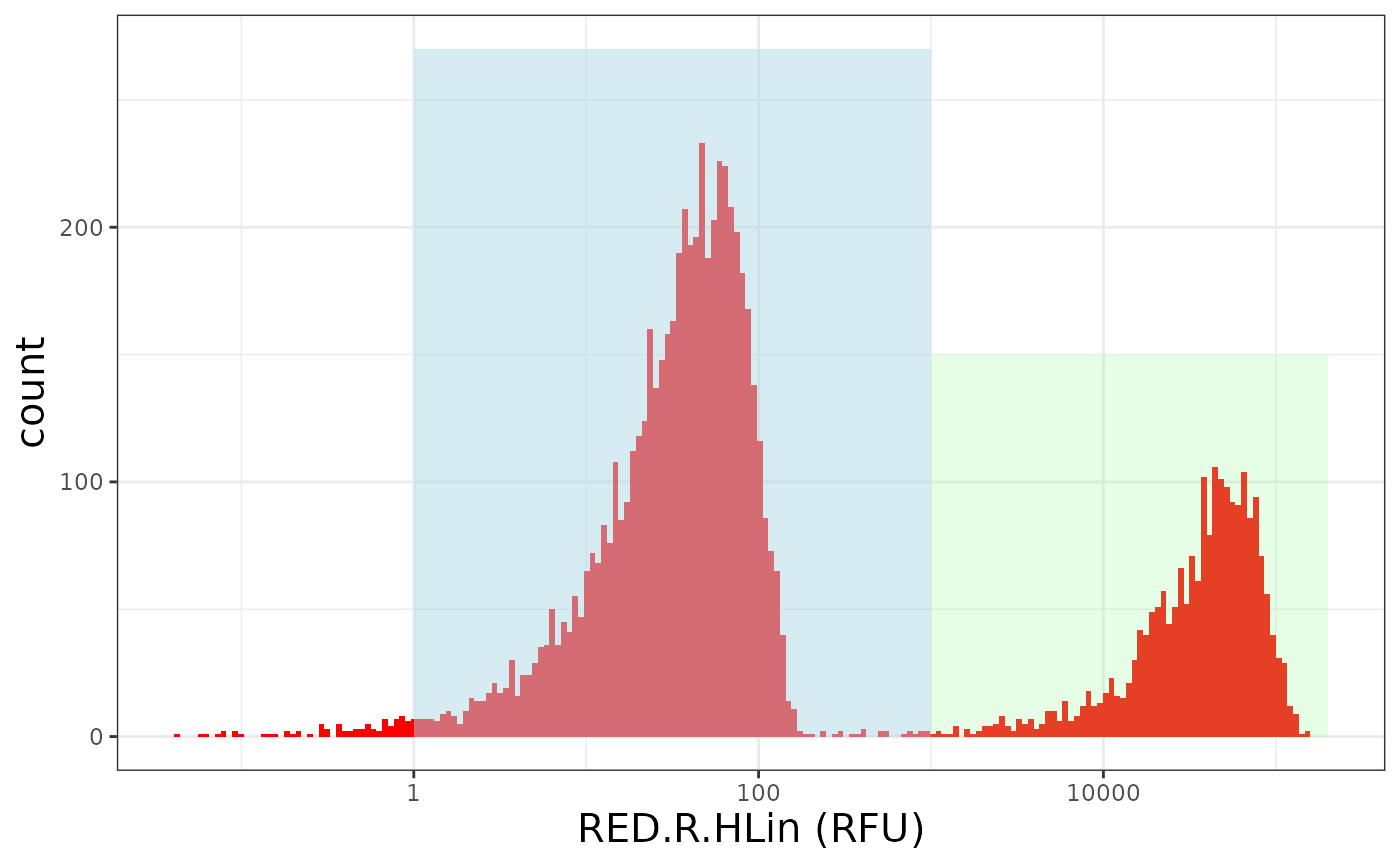
While a clear cutoff between these two peaks can be distinguished, we
have consistently observed that the exact location of this cutoff
changes from sample to sample. Thus, manually gating the MyHC+ cells is
time-consuming. In FlowFate, we automated this process using
gate_flowclust_1d( ), a data-driven gating function from
openCyto.
We wrapped the entire process into a custom function,
getData_splitPeak( ). Conveniently, the
gate_flowclust_1d( ) not only determines a cutoff between
two populations but also immediately creates a gate from this cutoff.
Thus, the output from getData_splitPeak( ) is a list of
gates. Sometimes biological samples are of poor quality and the GFP+
population or its subpopulation only count very few cells. If the number
of cells is too low, the algorithm behind
gate_flowclust_1d( ) breaks which produces an error. To
stop the entire app from crashig, we use tryCatch(). For
samples where gate_flowclust_1d( ) is unable to establish a
cutoff between the MyHC- and MyHC+ population, the resulting gate
evaluates to NULL. We remove these NULLs with another custom function,
remove_null_from_list( ).
getData_splitPeak <- function(r, gs, bin, filter_name) {
  ## fetch the data we need. bin = name of the gate to extract data from, used to access "GFP-low", "GFP-medium" and "GFP-high" gates
  x <- gs_pop_get_data(gs, bin) |> cytoset_to_flowSet()
  ## x is a flowSet. To each flowFrame, we apply the function tryCatch(). If no error, returns a gate that cuts between myosin peaks. If error, the respective gate evaluates to NULL
  x <- fsApply(x, function(fr, filterId = filter_name) {
    return(tryCatch(gate_flowclust_1d(fr, params = r$ch_myhc(), K = 2, cutpoint_method = "min_density", filterId = filterId), error = function(e) NULL))
  })
  ## we don't want the gates that evaluate to NULL, so we remove them using the custom function remove_null_from_list()
  return(remove_null_from_list(x))
}
remove_null_from_list <- function(data) {
  ## capture the indices of the the elements that are NULL, assign indices to test variable
  test <- which(sapply(data, is.null))
  ## when no NULLs (test variable of size 0), return the input data
  if (sum(test) == 0) {
    return(data)
  }
  ## when NULLs identified (test variable of size != 0), return the input data WITHOUT the positions that were NULL
  else {
    return(data[-test])
  }
}
Note that everything getData_splitPeak( ) is supposed to
do is to (1) look at the fluorescent intensity distribution in the red
channel of every dataset and (2) find a threshold between the MyHC- and
MyHC+ peaks for for each dataset and create a gate from it. Remember
that we have previously split the GFP+ population into one, two or three
subpopulations, depending on the user’s choices. Thus, for each dataset
we also need to establish one, two or three MyHC+ gates. This is why we
set the bin argument getData_splitPeak( ) to
either GFP-low, GFP-medium or
GFP-high. Below, we save the MyHC+ gates for each of these
subpopulations (or bins) and for all the samples in three different
variables.
gfp_low_myo_high <- reactive({
  req(r$gs)
  withProgress(message = "Retrieving data from GFP-low bin...", {
    if (any(str_detect(gs_get_pop_paths(r$gs), "GFP-low"))) {   #make sure GFP-low exists!
      getData_splitPeak(r = r, gs = r$gs, bin = "GFP-low", filter_name = "MyHC+")
    }})
})
gfp_medium_myo_high <- reactive({
  req(r$gs)
  withProgress(message = "Retrieving data from GFP-low bin...", {
    if (any(str_detect(gs_get_pop_paths(r$gs), "GFP-medium"))) {   #make sure GFP-medium exists!
      getData_splitPeak(r = r, gs = r$gs, bin = "GFP-medium", filter_name = "MyHC+")
    }})
})
gfp_high_myo_high <- reactive({
  req(r$gs)
  withProgress(message = "Retrieving data from GFP-high bin...", {
    if (any(str_detect(gs_get_pop_paths(r$gs), "GFP-high"))) {   #make sure GFP-high exists!
      getData_splitPeak(r = r, gs = r$gs, bin = "GFP-high", filter_name = "MyHC+")
    }})
})
Once all these cutoffs have been determined and MyHC+ gates created,
the actual gating is achieved by adding the gates to the GatingSet and
recomputing the GatingSet. The function below first checks if one of the
gate lists (gfp_low_myo_high,
gfp_medium_myo_high, gfp_high_myo_high) is
NULL. If not, the gate is added using the custom
add_gate( ) function.
observe({
  if (!is.null(gfp_low_myo_high())) {add_gate(r = r, gs = r$gs, gate = gfp_low_myo_high(), parent = "GFP-low")}
  if (!is.null(gfp_medium_myo_high())) {add_gate(r = r, gs = r$gs, gate = gfp_medium_myo_high(), parent = "GFP-medium")}
  if (!is.null(gfp_high_myo_high())) {add_gate(r = r, gs = r$gs, gate = gfp_high_myo_high(), parent = "GFP-high")}
  observer.state.split(TRUE)
  updateTabsetPanel(inputId = "tabset-mainPanel", selected = "Plot")
}) |> bindEvent(input$split)
add_gate( ) adds a gate to the matching GatingSet sample
and recomputes the GatingSet.
add_gate <- function(r, gs, gate, parent) {
  gate_names <- names(gate)
  gatingSet_names <- sampleNames(gs)
  for (i in seq_along(gatingSet_names)) {
    if (gatingSet_names[i] %in% gate_names) {
      x <- which(gatingSet_names[i] == gate_names) # gives the index of the name in gate_names that matches gatingSet_names
      gs_pop_add(r$gs[[i]], gate = gate[[x]], parent = parent)
    }
  }
  recompute(r$gs)
}
The data analysis is now complete. Below is a recap of what has been achieved:
- FCS files were read into R
- The GFP signal captured from control samples was used to establish a threshold defining a GFP+ population of transfected cells.
- The GFP+ population was split into distinct subpopulations based on a user-defined intensity interval. This allows us to investigate the effect of the extent of KRAS expression on C2C12 differentiation.
- Inside each GFP subpopulation, we gated the differentiated cells using a data-driven, peak-splitting algorithm.